Kubernetes
Tips
0.1. kubectl Editor with Visual Studio Code
Overview
One useful tip when working with Kubernetes is configuring your text editor for editing YAML files directly from the command line. If you use Visual Studio Code, you can set it as the default editor for kubectl.
Configuration
-
This command sets the
KUBE_EDITORenvironment variable to use Visual Studio Code. The--waitflag tells VS Code to pause the command execution until the file is closed. Now, when you run commands like kubectl edit, it will open the file in Visual Studio Code.export KUBE_EDITOR='code --wait'
kubectl edit deployment <deployment-name>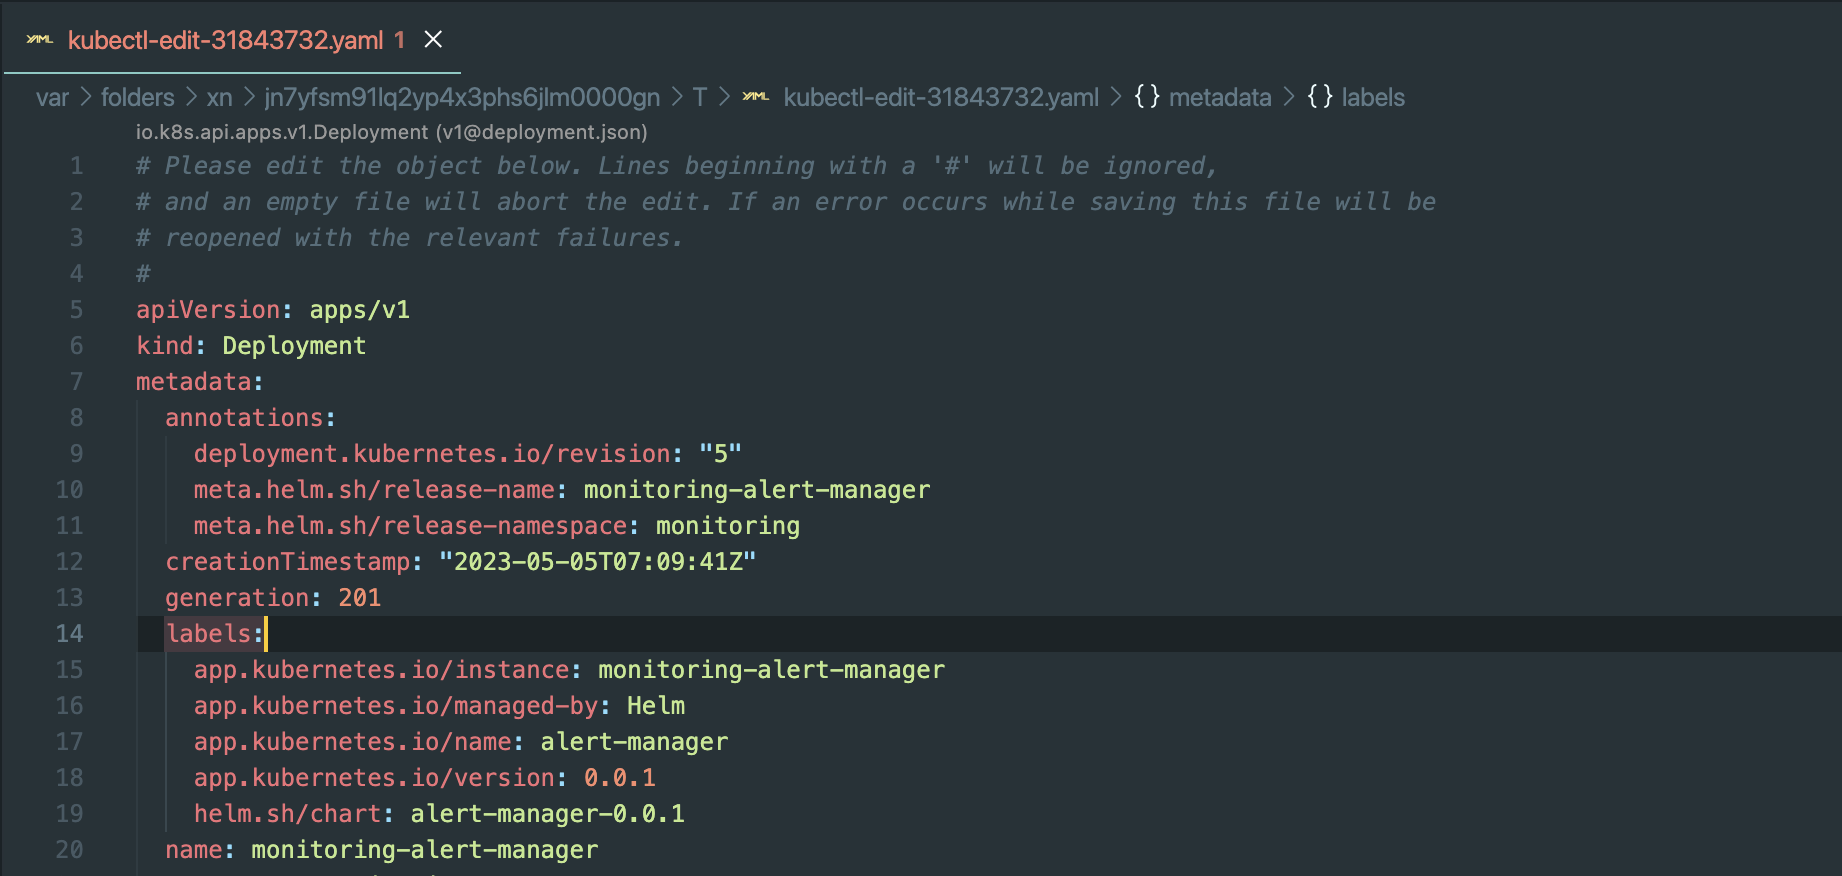
Monitoring
1.0. Robusta-Dev
Overview
Robusta is an open-source observability tool for Kubernetes that extends Prometheus. With automation rules, Robusta automatically fetches the data needed to investigate issues and attaches it to your alerts. Learn more at Robusta Documentation https://docs.robusta.dev/.
Installation
-
Generate a Config
-
Robusta requires settings to function, such as a Microsoft Team Token key if you use Microsoft Team. These settings are configured as Helm values.
-
For a quick start, use the Web Installation (recommended). Create the configuration via the free Robusta UI by clicking "Create Config."
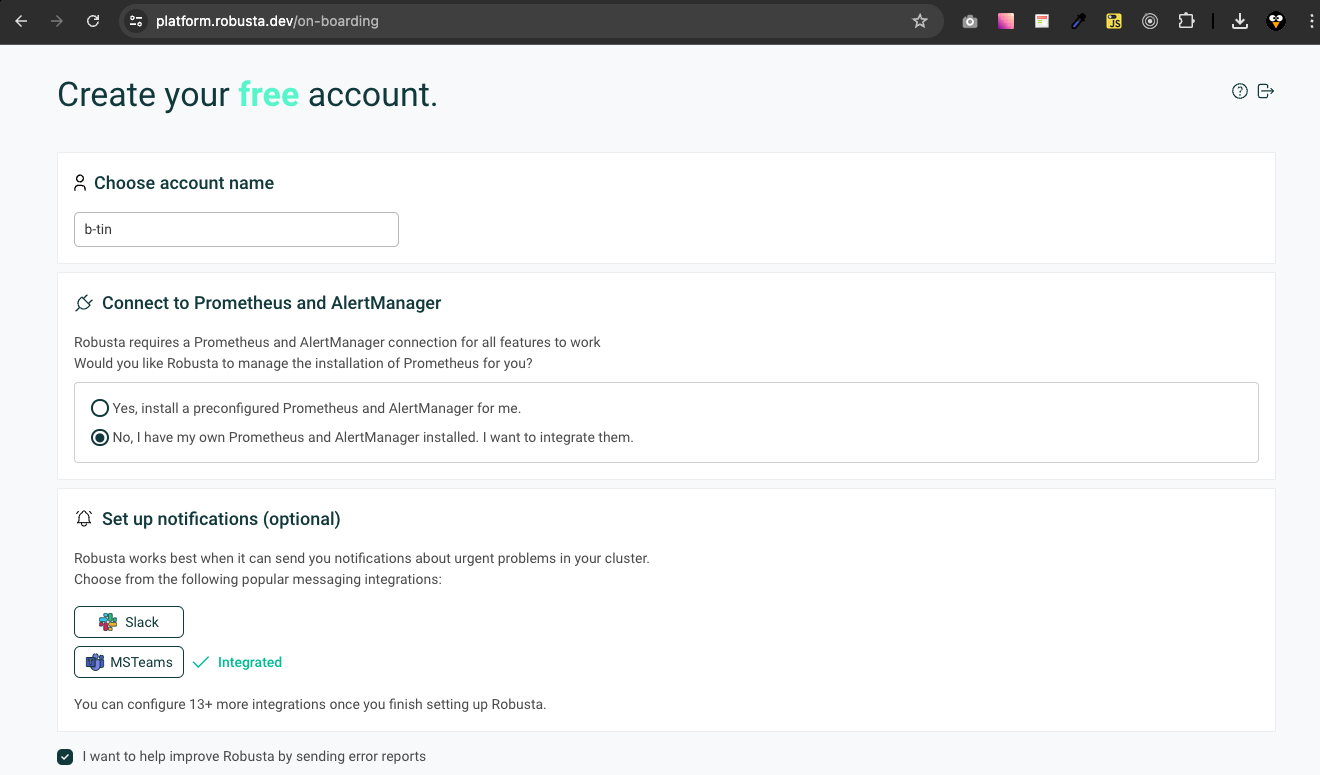
-
Generate the generated_values.yaml file by registering for a free account at Robusta and connect your existing EKS cluster with your chosen chat notification (Slack, Microsoft Teams, etc.).
-
-
Helm Installation
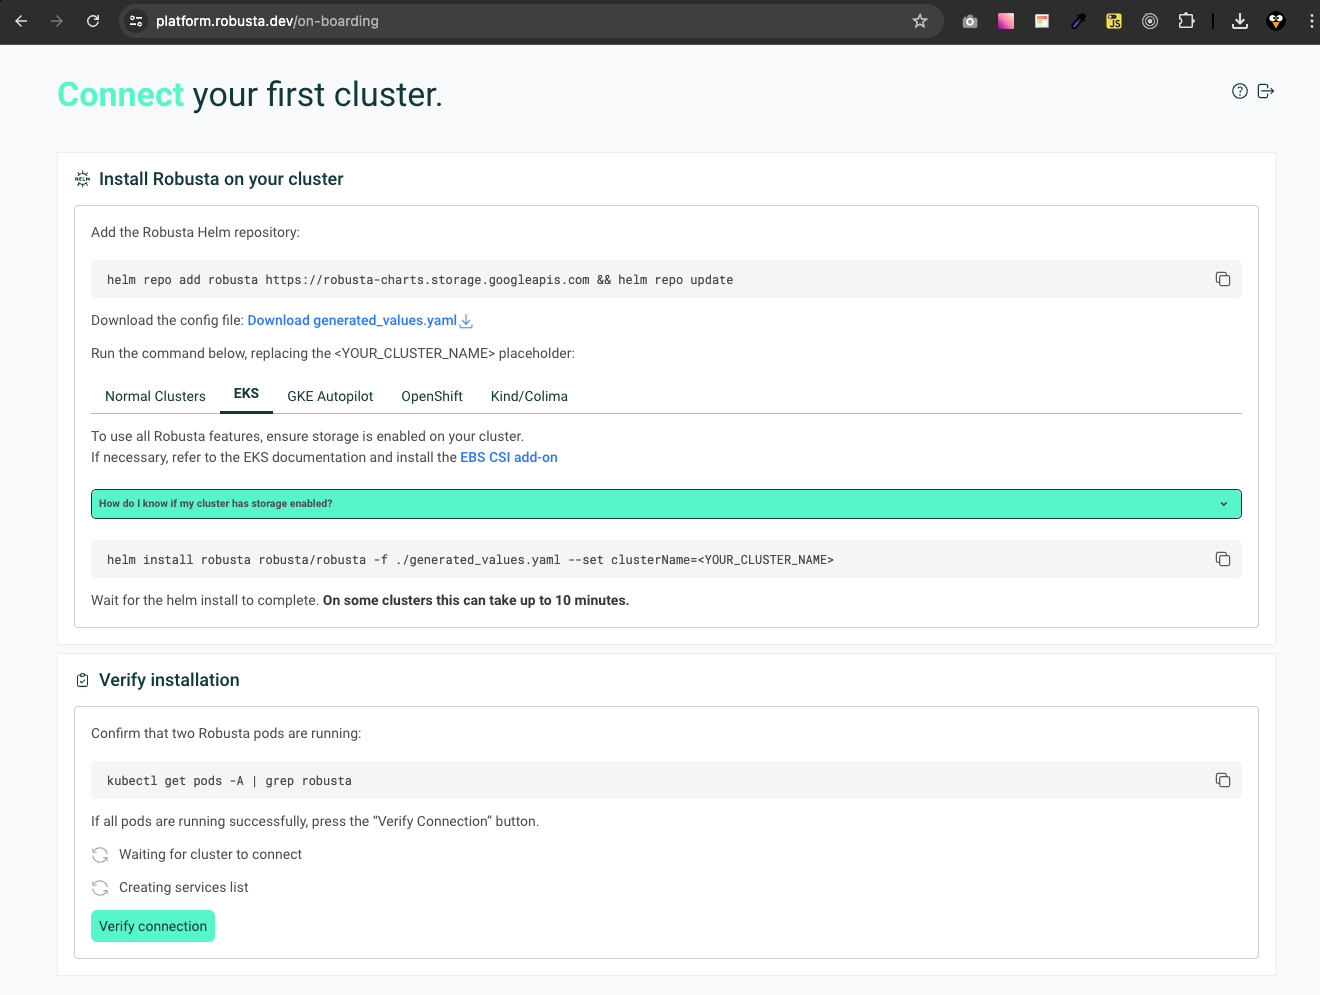
- Add the Robusta Helm repository and update it:
helm repo add robusta https://robusta-charts.storage.googleapis.com && helm repo update
helm search repo robusta/robusta
helm pull robusta/robusta --version 0.14.0- Install Robusta with the generated values file and verify the connection:
helm upgrade \
  --install \
  --create-namespace \
  --namespace monitoring \
  --timeout 30m monitoring-robusta robusta/robusta \
  --file ./generated_values.yaml \
  --set clusterName=b-tin-eks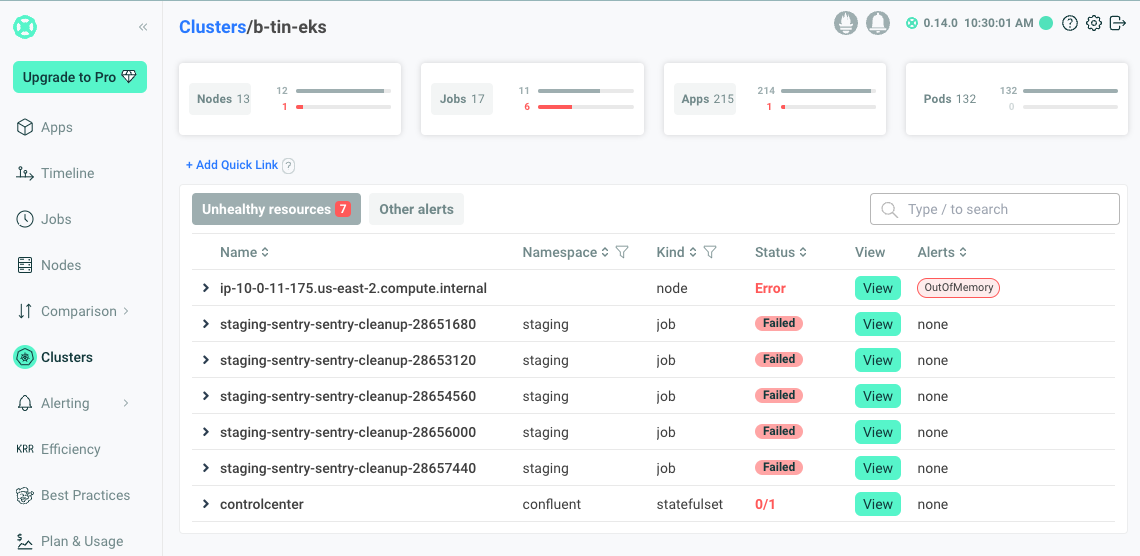
Integration With Existing Prometheus
-
Install Robusta alongside an existing Prometheus. Learn more at Extend Prometheus Installation.
-
Modify the generated_values.yaml file and reinstall Robusta with Helm
globalConfig:
  signing_key:
  account_id:
  alertmanager_url: "http://monitoring-alert-manager.monitoring:9093"
  prometheus_url: "http://monitoring-prometheus-server.monitoring"
sinksConfig:
  - robusta_sink:
      name: robusta_ui_sink
      token:
  - ms_teams_sink:
      name: main_msteams_sink
      webhook_url:
enablePrometheusStack: false
enablePlatformPlaybooks: true
enabledManagedConfiguration: true
runner:
  sendAdditionalTelemetry: true
additional_env_vars: [] -
Update your existing alertmanager configuration
apiVersion: v1
data:
  alertmanager.yml: |
    global: {}
    receivers:
    - name: default-receiver
      webhook_configs:
      - send_resolved: true
        url: http://monitoring-prom2teams.monitoring:8089
    - name: 'robusta'
      webhook_configs:
        - url: 'http://monitoring-robusta-runner.monitoring/api/alerts'
          send_resolved: true
    route:
      group_interval: 5m
      group_wait: 10s
      receiver: default-receiver
      repeat_interval: 24h
      routes:
      - receiver: 'robusta'
        group_by: [ '...' ]
        group_wait: 1s
        group_interval: 1s
        matchers:
          - severity =~ ".*"
        repeat_interval: 4h
        continue: true
      - group_by:
        - alertname
        - priority
        matchers:
        - severity="High"
        receiver: default-receiver
        repeat_interval: 1h
      - matchers:
        - severity="Warning"
        receiver: default-receiver
        repeat_interval: 6h
  allow-snippet-annotations: "false"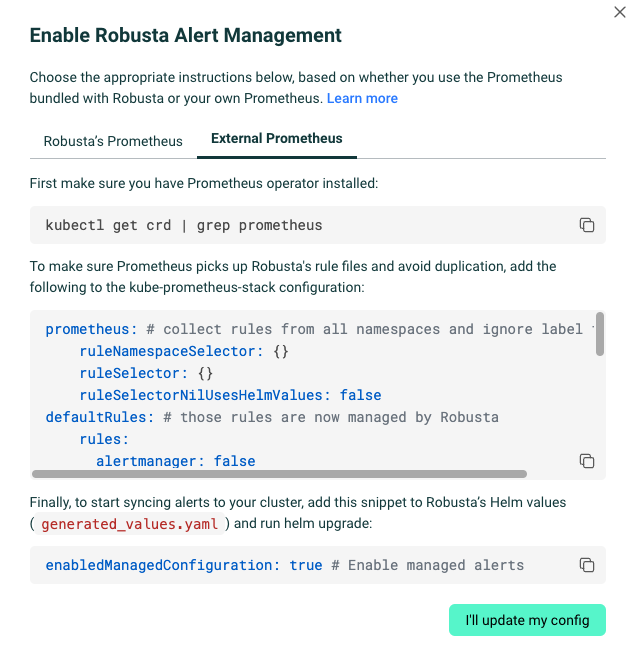
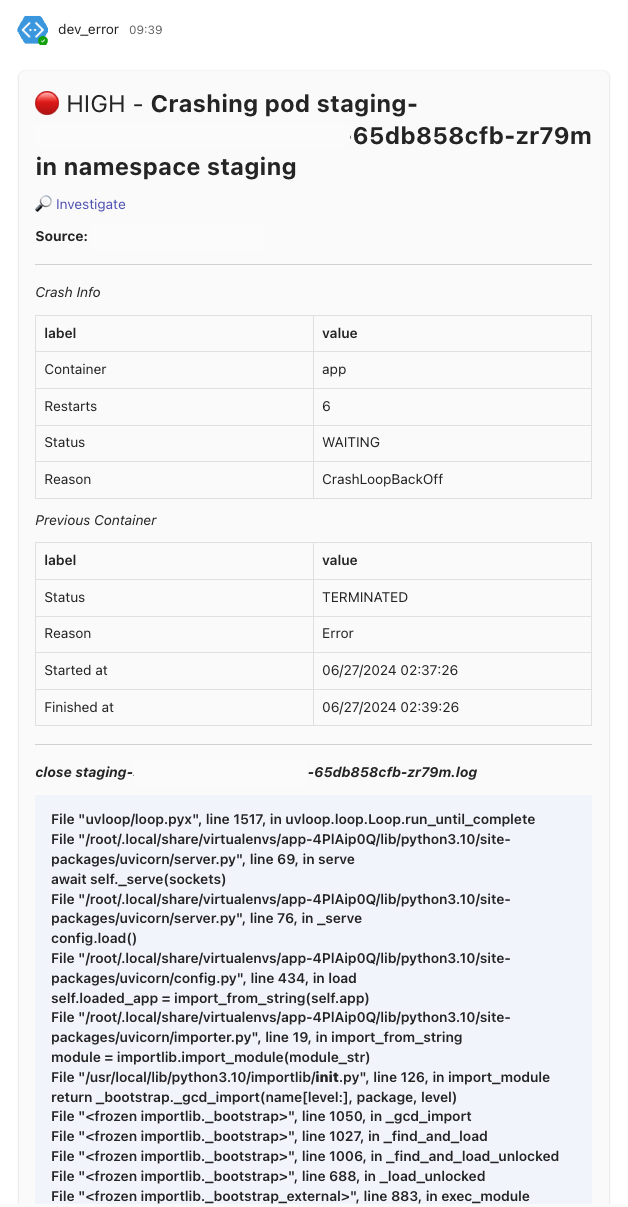
Alert Example
- Alerts from Robusta are sent to your configured chat notifications (e.g., Slack, Microsoft Teams) along with error logs. No need to access the ELK stack or Grafana Loki to check the error.